19
Oct
Google Analytics 4 (GA4) was officially launched around mid-October 2020. As I go through my daily doom scrolling across multiple forums and platforms, mainly Reddit, I still see the same questions being asked, the same lack of understanding of GA4, and the same help needed for custom reporting and a way to see things the way we used to (RIP Universal Analytics ☹️). Even more importantly, finding data that actually helps you see what is going on, what’s working, what isn’t, and if not, why it isn’t working.
When Google Analytics 4 first dropped, I immediately got to work, implementing it on my client’s websites, letting the data generate, and learning everything I could about the new interface and the way it tracks data. As a long-time user of Universal Analytics (almost 10 years of using the platform), it was a tough pill to swallow at first, but with most things in the SEO world, it was adapt, find another solution, or get left behind. So, I adapted and learned everything I possibly could to help my current client base.
What I learned quickly was that I wanted to be able to narrow in on channels by more than just source, medium, campaign, or whatever default garbage was in the report. I like seeing the organic search data, specifically, by landing page and by channel, along with better metrics than the defaults it gives us, so this is what this post is about: creating custom SEO reports that you can quickly and easily get to any time you log in to GA4.
Update: I was going back through this, and it read like one of those old-school recipe blogs with 7,000 words about things that didn’t matter, so I brought the important stuff up to the top. You can learn more below all of this, but here are the specific steps that I take to create custom GA4 reports.
Creating a Custom Organic Search GA4 Report
Okay, okay, enough of the boring stuff. Let’s get into why you’re here. I am going to go through a step-by-step way to create a custom Google Analytics 4 report, specifically an Organic Search report, and one that I set up and use for all websites that I work on.
There are, of course, many ways to get to the same outcome, but this is how I learned to create these and the fastest way I’ve been able to find.
So, let’s get to it.


Creating Quick Access To Your New Report
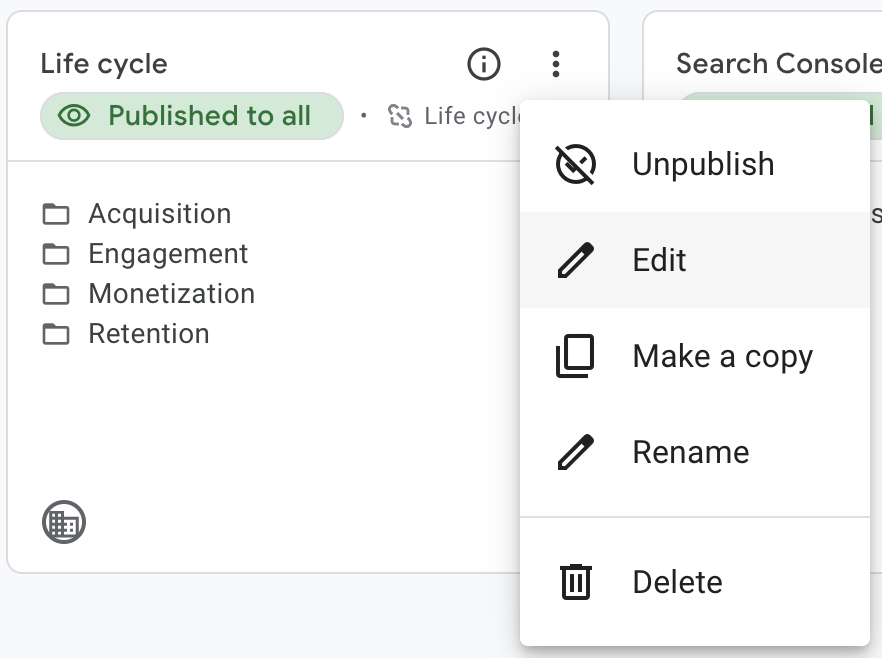
When your new report is created, it won’t be super accessible without doing one quick change to your left-hand reporting menu. To do that, we need to edit the Collections and add the new report to the Collection of your choice. Here’s how to do that.
Why Do Custom Reports Matter for SEO?
We’ve all been there. Sitting, staring at a screen, and trying to provide and show our value to our clients, stakeholders, bosses, whoever, but we can’t figure out how to navigate GA4, where to start, what some of these metrics mean, and how to convey it to our audiences. The session and user data are split up into separate report sections, so we’re bouncing back and forth, making sure we don’t jack the numbers up, wearing us down little by little.
With these custom reports, I am about to show you how to build, not only can we get back to something similar to Universal Analytics, but we can also create these reports anyway we want, once you start getting the hang of it, and customize it for the audience you are speaking to (while helping you get important info front and center).
With the limitations of GA4’s default reporting, we just can’t get the granular information we need to be able to prove value, show increases, and justify our worth. Custom reporting allows you to do that, and I am going to show you how!
Understanding Google Analytics 4
Before we get into going through and creating these reports, we need to understand how Google Analytics 4’s interface works and what each of these pieces is, which is important for later. Once I got the hang of this, things came together and allowed me to basically create any type of report I wanted to.
Channel grouping is just how it sounds. It’s a specific set of channels, such as “Email”, “Organic Search”, “Display”, “Paid Search”, “Direct”, etc, that allows you to compare user behavior for each of the channels in the group.

A dimension is simply an attribute of your data. This is something that describes your data and is usually text and not numbers. Some examples would be Source, Medium, Event Name, Age, Gender, City, Region, etc, etc, etc. You get it. If you want a full list of Google Analytics 4 dimensions, you can check them out here (I even filtered the list for you 😉). Dimensions are usually the dropdowns in each of your reports that allow you to switch how you look at the same data.

A metric is something that is quantitative and is always a number, versus a dimension that is text. Metrics are the pieces of information inside each of your reports in Google Analytics 4.
The report library is where you can come in and customize the reports that appear on your left-hand menu. Collections are things like “Life Cycle”, “Business Objectives”, “Search Console”, and some more (that I don’t usually use). This section allows you to add reports to certain collections that you can easily navigate to in your menu.

Speaking of collections, what are they? These are really just a set of specific reports that you can customize and even create new collections based on your needs. Life Cycle and User are default.

Before vs. After: Why Custom Reports Are Worth It
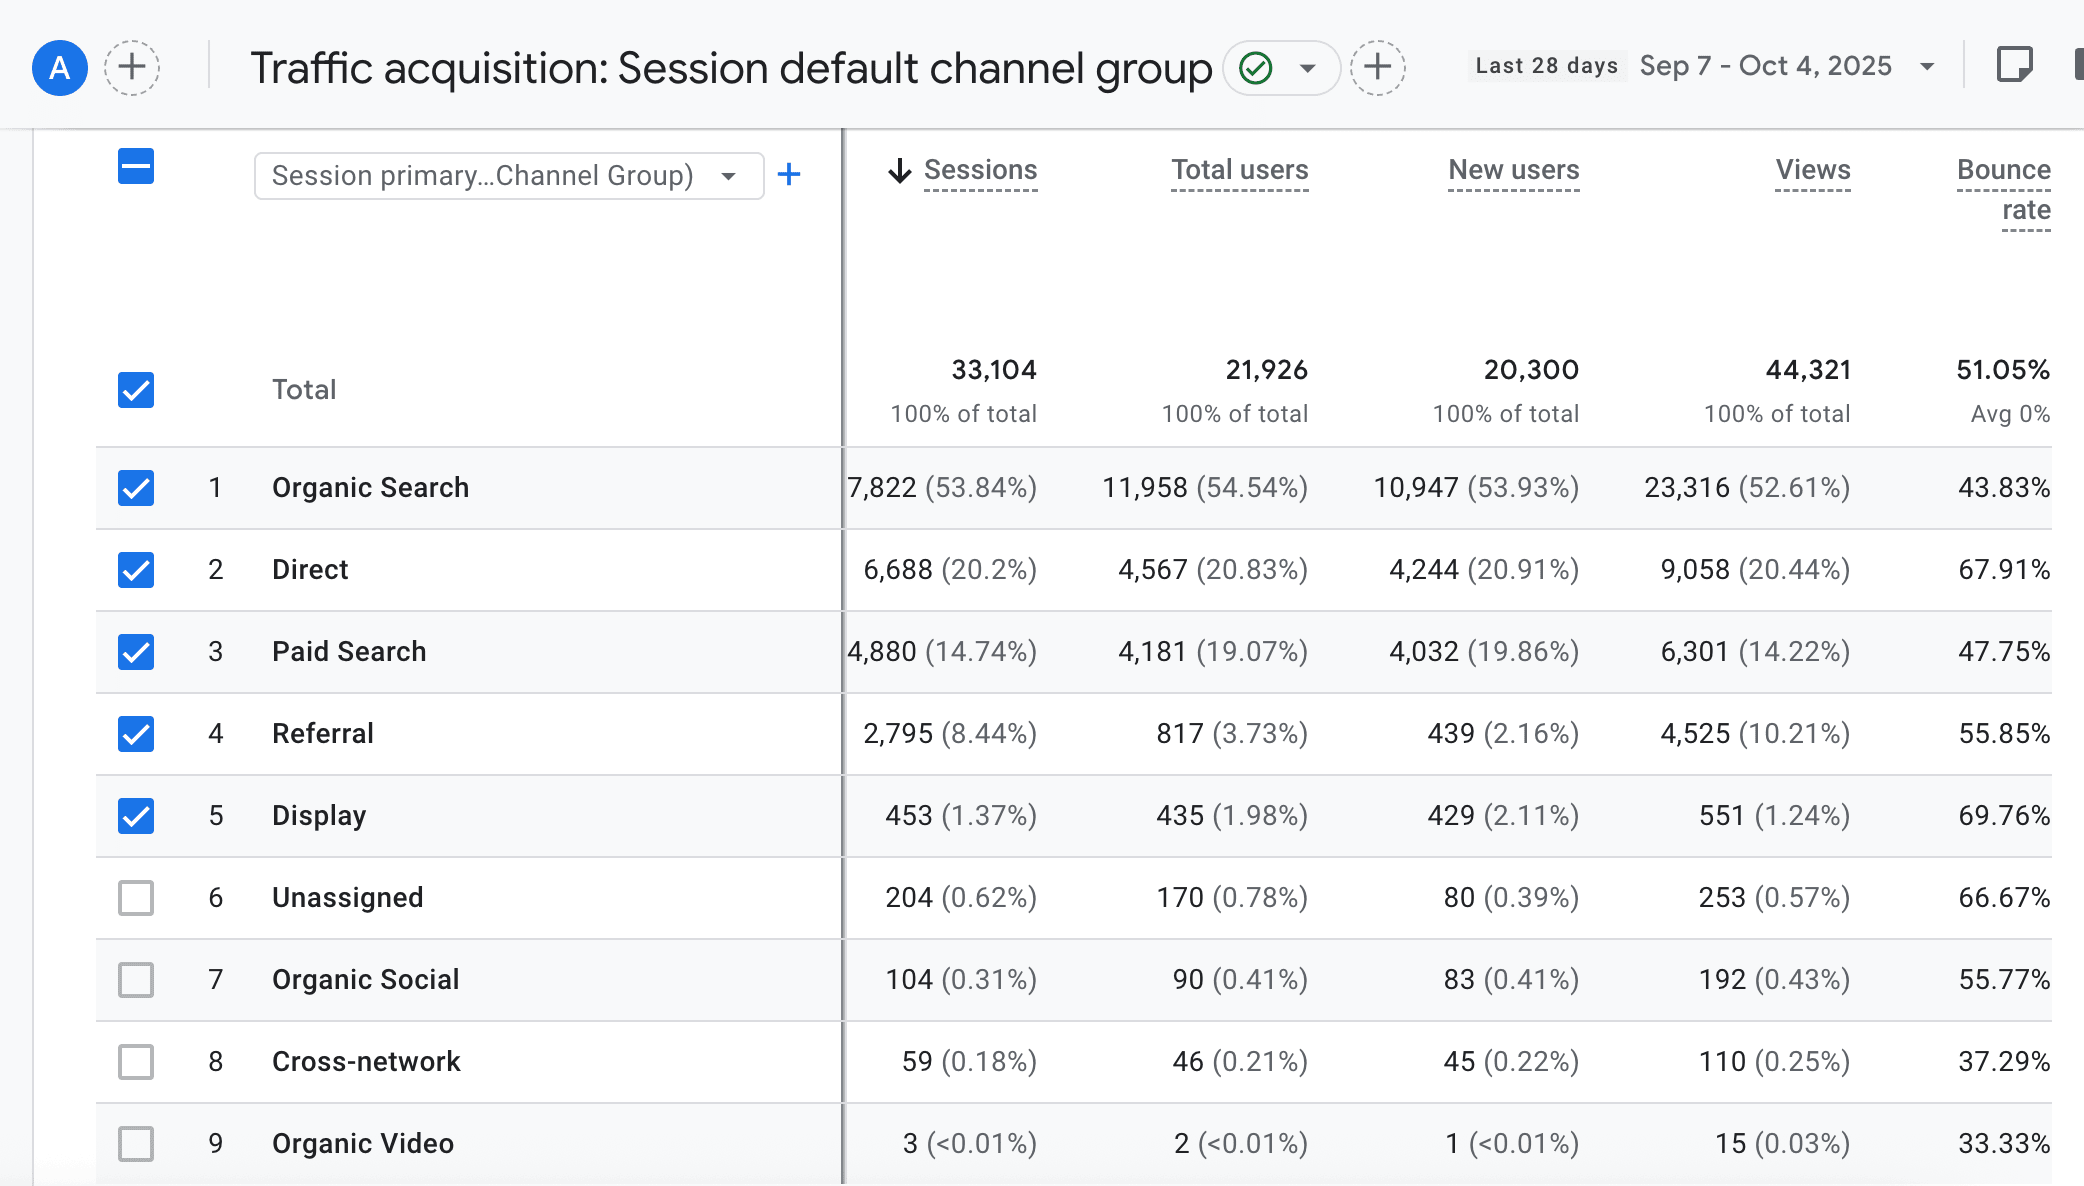
If you’ve ever stared at GA4’s default Traffic Acquisition report, you know how limited it feels. You’ll see traffic broken down by source/medium, but it rarely answers deeper questions like:
That’s the problem: GA4’s out-of-the-box view gives you data, but not insights.
By contrast, a custom Organic Search report by landing page immediately surfaces actionable info:
Once you experience the difference, it’s hard to go back to GA4’s defaults.
How to Interpret Your Custom Report
Building the report is step one. The real value comes from knowing what to look for. A few ways I use this organic search view:
Don’t just build the report and then do nothing with it. This is only valuable if you are reviewing the data, seeing what is working in your strategy, what isn’t, and where you have some opportunities.
Now You Have Your Custom Report
This is a great way to get some custom reporting for almost anything you can think of inside of Google Analytics 4. Once you start to learn and understand the dimensions, you can start to narrow in on more granular reporting for whatever you need. Some examples of how I use this to get quick reports:
With this custom GA4 reporting, we can get into reports that actually matter and actually show some sort of data, at a more granular level, that we can actually use in our decision-making. Yes, we can do something similar in Explorations, but I’ve found this to be the easiest route to get quick channel reporting on your marketing efforts.
Don’t Want To Do This Yourself?
If you have reviewed this and want to get even more granular or just have someone do it for you so you and your team can use the data, reach out today to see how I can help you create and leverage custom GA4 reporting for better decision-making.
![]()
Since 2015, I have been specializing in all areas of SEO ranging from advanced technical SEO to local, enterprise, national, and international SEO campaigns. I’ve helped grow agencies through specialized training curriculums and learning management systems to achieve quality consistency. I have a passion for helping teach people the ins and outs of SEO strategy, tactics, execution, and more!